

I. Introduction
In 2025, the global truck tyre market presented a new landscape amid complex economic shifts. As the world’s core supplier of truck tyres, China’s truck export data for the year reflects regional demand dynamics and changes in procurement strategies among major trading partners.
This article, based on China’s export data from January to December 2025, analyzes total volume, regional distribution, country-specific performance, and origin geography to serve as a reference for global truck tyre buyers and procurement professionals.
II. Overview of Truck Tyre Export Performance
In 2025, China’s truck tyre export value reached USD 10.16 billion (+2.94% YoY), with volume at 4.86 billion kg (+5.87%). Volume growth outpaced value growth, confirming a clear price advantage. For cost-sensitive buyers, China remains the best place to buy truck tires.
By trade mode, processing trade accounted for 56.88%, reflecting reliance on imported raw materials and deep global supply chain integration. General trade accounted for 39.33%, representing direct export capability. Buyers requiring raw material traceability should focus on processing-trade enterprises; those prioritizing shorter lead times may prefer general-trade partners.
III. Regional Distribution of Truck Tyre Exports
Asia remained the largest market for truck tyre export, with 2025 purchases at USD 3.83 billion (37.63%). Due to demand declines in Southeast Asia and parts of the Middle East, value and volume fell 4.62% and 2.71% YoY. Buyers should monitor still-growing markets like Vietnam (+8.33%) and the Philippines (+2.92%), while cautiously assessing inventory risks in Indonesia and Malaysia.
Percentage and data of tire purchasing expenditures by state


North America (13.63%) saw value and volume decline 8.06% and 4.12% respectively due to a drop in U.S. demand. Buyers should monitor U.S. inventory cycles and trade policy changes.
South America showed strong momentum with 21.16% and 27.02% growth in value and volume. Brazil (USD 177M), Colombia (USD 190M), and Peru (USD 189M) all maintained growth.
Africa led globally with 22.12% value growth and 25.28% volume growth, reaching USD 2.13 billion (20.92%). Africa is a key direction for buyers to buy truck tires, particularly high-growth countries like Nigeria, Tanzania, and Libya. The rapid expansion of the African truck tire market makes it a priority for international buyers.
Percentage of tire purchases by state and data
Europe and Oceania performed steadily. Australia (+4.55%), as a mature market with stable demand, is suitable for long-term partnerships.
IV. Top 30 Importing Countries of Truck Tyres
In 2025, 207 countries and territories purchased Chinese truck tyres. Key insights for buyers from the top 30 markets are as follows:
Mexico ranked first with USD 589 million, down 2.83% in value but up 1.70% in volume, indicating a decline in unit price. Mexico’s tyre demand mainly serves OEM and replacement markets for exports to the U.S. and Canada. Buyers seeking the best place to buy truck tires for North American distribution may consider Mexico as a strategic entry point.
UAE (USD 483 million) and Saudi Arabia (USD 426 million) ranked second and third, declining 7.83% and 11.45% respectively. The Middle East market remains weak overall; buyers should control inventory levels.
The U.S. fell to 15th place from its 2024 high, with imports of only USD 200 million, down 44.99% — the primary cause of North America’s decline. U.S. buyers should monitor trade policy changes and alternative supply sources.
Indonesia dropped 21.21%, the sharpest decline among the top 10, due to nickel export policy adjustments and infrastructure project slowdowns. Buyers should reduce shipments to this market.
| Rank | Country | 2025 Import Value (USD 100M) | Share (%) | YoY Growth (%) |
|---|---|---|---|---|
| 1 | Mexico | 5.89 | 5.79 | -2.83 |
| 2 | UAE | 4.83 | 4.75 | -7.83 |
| 3 | Saudi Arabia | 4.26 | 4.19 | -11.45 |
| 4 | Australia | 3.36 | 3.31 | 4.55 |
| 5 | Russia | 3.29 | 3.23 | -7.74 |
| 6 | Nigeria | 2.97 | 2.93 | 24.65 |
| 7 | Indonesia | 2.88 | 2.84 | -21.21 |
| 8 | Canada | 2.61 | 2.57 | 7.99 |
| 9 | Iraq | 2.5 | 2.46 | -10.14 |
| 10 | Vietnam | 2.43 | 2.39 | 8.33 |
| 11 | Malaysia | 2.28 | 2.24 | -12.76 |
| 12 | Philippines | 2.21 | 2.17 | 2.92 |
| 13 | Chile | 2 | 1.97 | 17.53 |
| 14 | South Korea | 2 | 1.97 | 17.31 |
| 15 | U.S. | 2 | 1.97 | -44.99 |
| 16 | Colombia | 1.9 | 1.87 | 26.05 |
| 17 | Peru | 1.89 | 1.86 | 26.22 |
| 18 | Paraguay | 1.82 | 1.79 | 29.5 |
| 19 | Brazil | 1.77 | 1.74 | -2.2 |
| 20 | Tanzania | 1.57 | 1.54 | 30.31 |
| 21 | South Africa | 1.51 | 1.49 | 18.99 |
| 22 | Libya | 1.4 | 1.38 | 61.05 |
| 23 | Kenya | 1.37 | 1.35 | 5.33 |
| 24 | Thailand | 1.37 | 1.35 | 26.69 |
| 25 | Algeria | 1.35 | 1.33 | 32.27 |
| 26 | UK | 1.34 | 1.32 | 11.83 |
| 27 | Ghana | 1.1 | 1.08 | -9.89 |
| 28 | Guinea | 1.1 | 1.08 | 117.38 |
| 29 | Argentina | 1.04 | 1.03 | 63.01 |
| 30 | Netherlands | 1.04 | 1.02 | 12.68 |
V. Top 20 Fastest-Growing Truck Tyre Import Markets
While global growth was only 2.94%, several emerging markets significantly outperformed. These markets represent key opportunities for buyers seeking to expand.
Guinea (+117.38%) and Sudan (+104.13%) benefited from mining development and infrastructure projects in Africa. Buyers should focus on heavy-load mining tyre supply for these markets.
Senegal (+86.40%), Turkey (+81.49%), and Czech Republic (+66.20%) also grew rapidly. Turkey, as a Eurasia hub, serves both European and Asian markets.
More than half of the top 20 growth markets are African countries, confirming the comprehensive rise of the African truck tire market. Buyers should consider establishing distribution points or partnerships with local dealers in Africa to capture demand from infrastructure and mining development.
| Rank | Country | YoY Growth (%) | 2025 Import Value (USD 100M) |
|---|---|---|---|
| 1 | Guinea | 117.38 | 1.1 |
| 2 | Sudan | 104.13 | 0.42 |
| 3 | Senegal | 86.4 | 0.3 |
| 4 | Turkey | 81.49 | 0.36 |
| 5 | Czech Republic | 66.2 | 0.14 |
| 6 | Argentina | 63.01 | 1.04 |
| 7 | Libya | 61.05 | 1.4 |
| 8 | Morocco | 56.6 | 0.31 |
| 9 | Burkina Faso | 52.22 | 0.18 |
| 10 | North Korea | 49.33 | 0.33 |
| 11 | Benin | 48.22 | 0.1 |
| 12 | Cuba | 44.85 | 0.08 |
| 13 | Mozambique | 43.13 | 0.65 |
| 14 | Kyrgyzstan | 41.54 | 0.32 |
| 15 | Suriname | 40.66 | 0.05 |
| 16 | Haiti | 38.8 | 0.12 |
| 17 | Tajikistan | 35.65 | 0.25 |
| 18 | Somalia | 34.55 | 0.39 |
| 19 | Côte d'Ivoire | 33.73 | 0.58 |
| 20 | Algeria | 32.27 | 1.35 |
VI. Key Market Analysis
1. Mexico (USD 589M, -2.83%)
- Unit price declined (value -2.83% but volume +1.70%)
- October peak at USD 78.1M (+48.34% YoY), aligning with North American peak-season stocking
→ Build inventory before October; leverage Mexico’s location to serve U.S. and Canadian markets. Mexico is a top entry point for North America.
2. Saudi Arabia (USD 426M, -11.45%)
March peak at USD 47.1M; sharp December drop (-42.48% MoM) due to oil price volatility and fiscal tightening
→ Reduce routine inventory; adopt order-based purchasing.
3. Australia (USD 336M, +4.55%)
March peak at USD 47.1M; sharp December drop (-42.48% MoM) due to oil price volatility and fiscal tightening
→ Reduce routine inventory; adopt order-based purchasing.
4. Russia (USD 329M, -7.74%)
- July peak at USD 32.8M (still -11.56% YoY); Chinese tyres filled Western brand gaps, but economic volatility and local capacity recovery capped growth
→ Monitor Russia’s local capacity trends.
5. Nigeria (USD 297M, +24.65%)
Peaks in March and December; December up 68.81% MoM
→ Build inventory in February and November ahead of peaks.
6. Indonesia (USD 288M, -21.21%)
Sharpest decline among top 10; nickel policy changes and infrastructure slowdowns
→ Reduce routine inventory; adopt make-to-order models.
7. Canada (USD 261M, +7.99%)
Strong performance in July (+25.19%) and December (+38.08%)
→ Use Canadian ports to access North America while mitigating U.S. trade risks.
8. Iraq (USD 250M, -10.14%)
- Peaks in March (+66.87%) and December (+37.62%) despite political and fiscal constraints
→ Adopt phased delivery and milestone-based payments to control credit risk.

VII. Major Production Bases in China
China’s truck tyre export production is highly concentrated, with Shandong as the core and Zhejiang and Jiangsu as secondary hubs. Chinese truck tyre manufacturing spans multiple regions, each with distinct strengths. Buyers may select suppliers based on each region’s characteristics.
1. Shandong – USD 6.20B (61.05% of national total), +0.31% growth
Strengths: Largest production base; dominates Mexico, Middle East, and Africa
Best for: High-volume procurement, OEM partnerships, cost advantage through economies of scale
→ Suits buyers seeking large capacity and competitive pricing.
2. Zhejiang – USD 927M (9.12%), +3.80% growth
Strengths: Stronger brand and product differentiation; focuses on mid-to-high-end markets (Mexico, Saudi Arabia, Chile)
→ Suits buyers seeking branded or premium products.
3. Jiangsu – USD 536M, +14.52% growth (fastest among top five)
Strengths: Diversified export footprint; strong in U.S., South Korea, and UK; competitive quality and international operations
→ Suits quality-focused buyers.
4. Liaoning – Below USD 536M, -4.71% growth
Strengths: Serves neighboring markets like North Korea and Afghanistan
→ Suits buyers targeting Northeast Asian border markets.
5. Henan – Below USD 536M, +2.86% growth
Strengths: Serves Indonesia, Netherlands, and Australia
→ Suits buyers targeting Southeast Asia, Europe, and Oceania.
VIII. Shandong Tyre Sourcing Guide
Shandong is the core production base for truck tyre export, accounting for 61.05% of the national total.
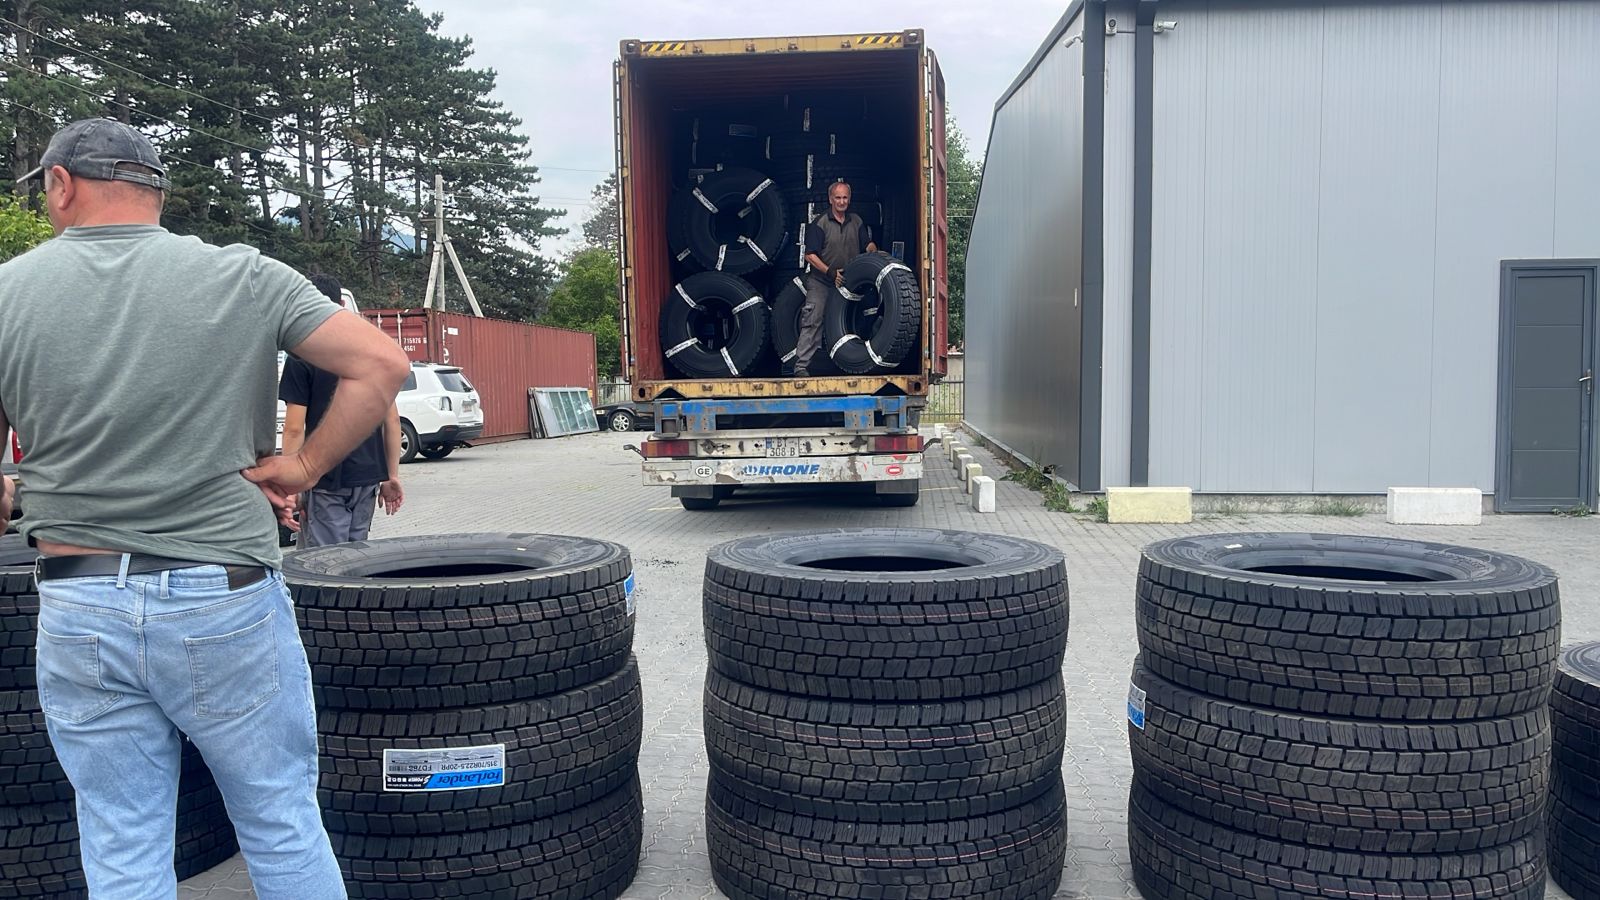
Forlander is one of Shandong’s popular tyre brands:
-
Overview: Founded in 2011, with assets nearing RMB 2 billion. Exports to over 150 countries.
-
Product Range: Full range covering TBR, PCR, OTR, and agricultural tyres. Rich tread patterns and sizes available.
-
Certifications: DOT, ECE, GCC, INMETRO, SONCAP, CCC, REACH, ISO 9001, ISO/TS16949.
-
Capacity: 2.5M all-steel radial truck tyres, 1M bias tyres.
Procurement Inquiries: Specify model, size, quantity, and FOB port. Place orders 2-3 months in advance. ODM/OEM customization supported.
IX. Conclusion
China’s truck tyre export market grew in 2025, yet structural divergence was significant. Africa and South America drove growth, while North America and parts of Asia contracted. Traditional markets like Mexico and the UAE slowed, while Turkey, Sudan, and Guinea are key emerging opportunities. Shandong remains dominant; Jiangsu offers alternatives. Buyers should align procurement with regional demand, seasonal peaks, and production bases. The outlook remains positive, led by Africa and South America.