
I. Introduction
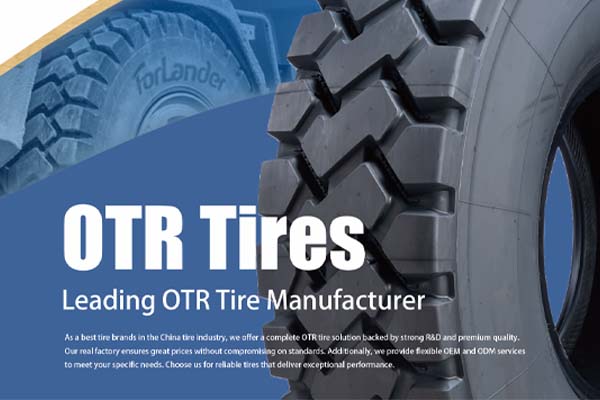
Natural rubber prices have risen sharply, with the main contract on the Shanghai Futures Exchange briefly exceeding RMB 20,000 per tonne, a multi-year high, and spot prices up more than 28% year to date. Since September, more than 60 tire companies have issued over 70 price increase letters covering all-steel, semi-steel and OTR tires, with adjustments generally at 2% to 5%. Forlander Tire summarizes the causes, supply landscape and implications of the tire price increase 2026 for overseas buyers, distributors and industry partners.

II. Drivers of the Natural Rubber Price Increase
The natural rubber price increase results from three combined factors.

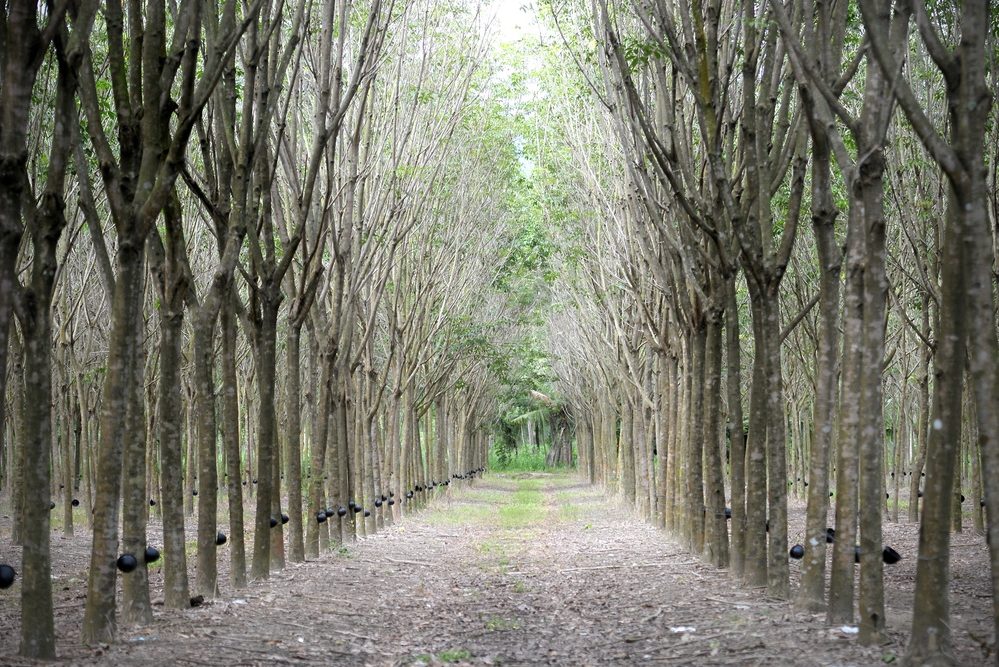
Industry cycle: Growth in global tapping area has slowed and supply has entered a contraction phase. Rubber trees need 6 to 8 years to begin tapping and 13 to 15 years to reach peak output, so capacity adjustment lags. The previous low-price cycle discouraged replanting, the share of aging trees in Southeast Asia has risen, some plantations have converted to oil palm, and new planting area is limited.
Weather: Thailand, Indonesia, Vietnam and Malaysia account for over 70% of global output. A super El Niño has formed, with drought signals in Sumatra and the Malay Peninsula and reduced rainfall in southern Thailand and Vietnam. Historical data show output losses in previous super El Niño events, but the impact lags by 3 to 6 months, so markets are pricing in expectations in advance.
Capital flows: Expectations of global liquidity easing have brought capital into commodities, amplifying price volatility.
III. Supply-Side Data and Inventory
Output: ANRPC data show member output up 9.24% month on month in July but down 2.11% year on year; Vietnam fell sharply, Thailand grew weakly, and producing countries’ exports contracted.
Imports: China imported 486,000 tonnes in August, down 6.7% year on year, the lowest for the period in six years.
Inventory: Qingdao bonded and general trade inventories have fallen for weeks, with bonded inventories at multi-year lows. Qingdao stocks fell to about 90,000 tonnes from about 150,000 tonnes, and turnover shortened from six months to about three.
Substitutes: High crude oil prices raised synthetic rubber costs, supporting natural rubber.

Industry participants note that imports and domestic output have not fallen significantly and that prices mainly reflect expectations. Q4 through Q1 is the core window for verifying the El Niño production-cut logic, with attention to Southeast Asian weather, ANRPC output, heavy truck replacement, auto consumption and tire exports.
IV. Impact of the Tire Price Increase 2026 on Manufacturing and Procurement
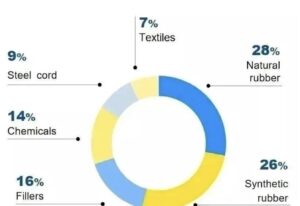
Raw materials account for over 70% of tire production costs, with natural rubber, synthetic rubber and carbon black together exceeding 60%, so rising tyre raw material prices directly raise costs. Since September, the industry has seen its fourth round of concentrated price increases this year, with adjustments generally at 2% to 5% and up to 6% for some specifications; some companies have raised prices twice since August.

Leading companies offset pressure through price increases, product mix optimization, overseas capacity, long-term contract pricing and hedging, while smaller companies face greater pressure. Disclosed data show some companies’ average tire price rose 8.37% year on year and 8.48% quarter on quarter in Q2; another reported effective price adjustments at home and abroad, full order books and relatively rapid sales growth.
V. Global Layout of Supply-Side Companies
Upstream global layout supports supply continuity. One full-chain company manages 4.9 million mu of land worldwide, including 3.8 million mu of plantations, with 30 planting bases, over 70 years of experience and 1.8 million mu of standardized plantations under staged construction. It operates 57 primary processing plants with annual capacity of about 2.17 million tonnes, producing whole latex rubber, concentrated latex, smoked sheet and Indonesian standard rubber. Another international supply chain company has plantations and processing plants in Southeast Asia, Africa and China, supplying tire and industrial customers worldwide.
VI. Conclusion
The tire price increase 2026 results from the combined effect of the industry cycle, weather and capital flows, and has been transmitted through costs into tire manufacturing and sales.
On the supply side, slowing tapping area growth, aging trees and limited new planting, together with El Niño production-cut expectations, make insufficient supply elasticity a medium-term feature.
On the demand side, tire companies have responded through price adjustments, product mix changes, overseas capacity and hedging, with leading companies’ implementation and orders generally stable. For overseas buyers and distributors, the current phase requires attention to Southeast Asian weather and output verification from Q4 through Q1, raw material price trends and the pace of tire costs adjustments, while keeping procurement and inventory plans flexible.
Forlander Tire will continue to monitor upstream and downstream changes, keep partners informed in a timely manner, and support business arrangements through stable supply and transparent communication.